Sankey ابزاری جالب برای طراحی جریان

جینگیلبرت

کاربر حرفه ای
کاربر ممتاز
نمودارهای سنکی (Sankey)

گفته میشود که نمودارهای سنکی sankey به اندازه یک هزار نمودار آماری حرف برای گفتن دارند!


برای اولین بار در جنگ جهانی اول و در سال 1812 توسط مهندس فرانسوی فارغ التحصیل دانشگاه پلی تکنیک سوئیس چارلز مینارد طبق شکل زیر و به منظور تشریح جنگ مصیبت بار ناپلئون با روسیه طراحی شد


همچنین این مهندس خلاق فرانسوی برای سایر موارد نیز نقشه های جریان ترسیم نموده است
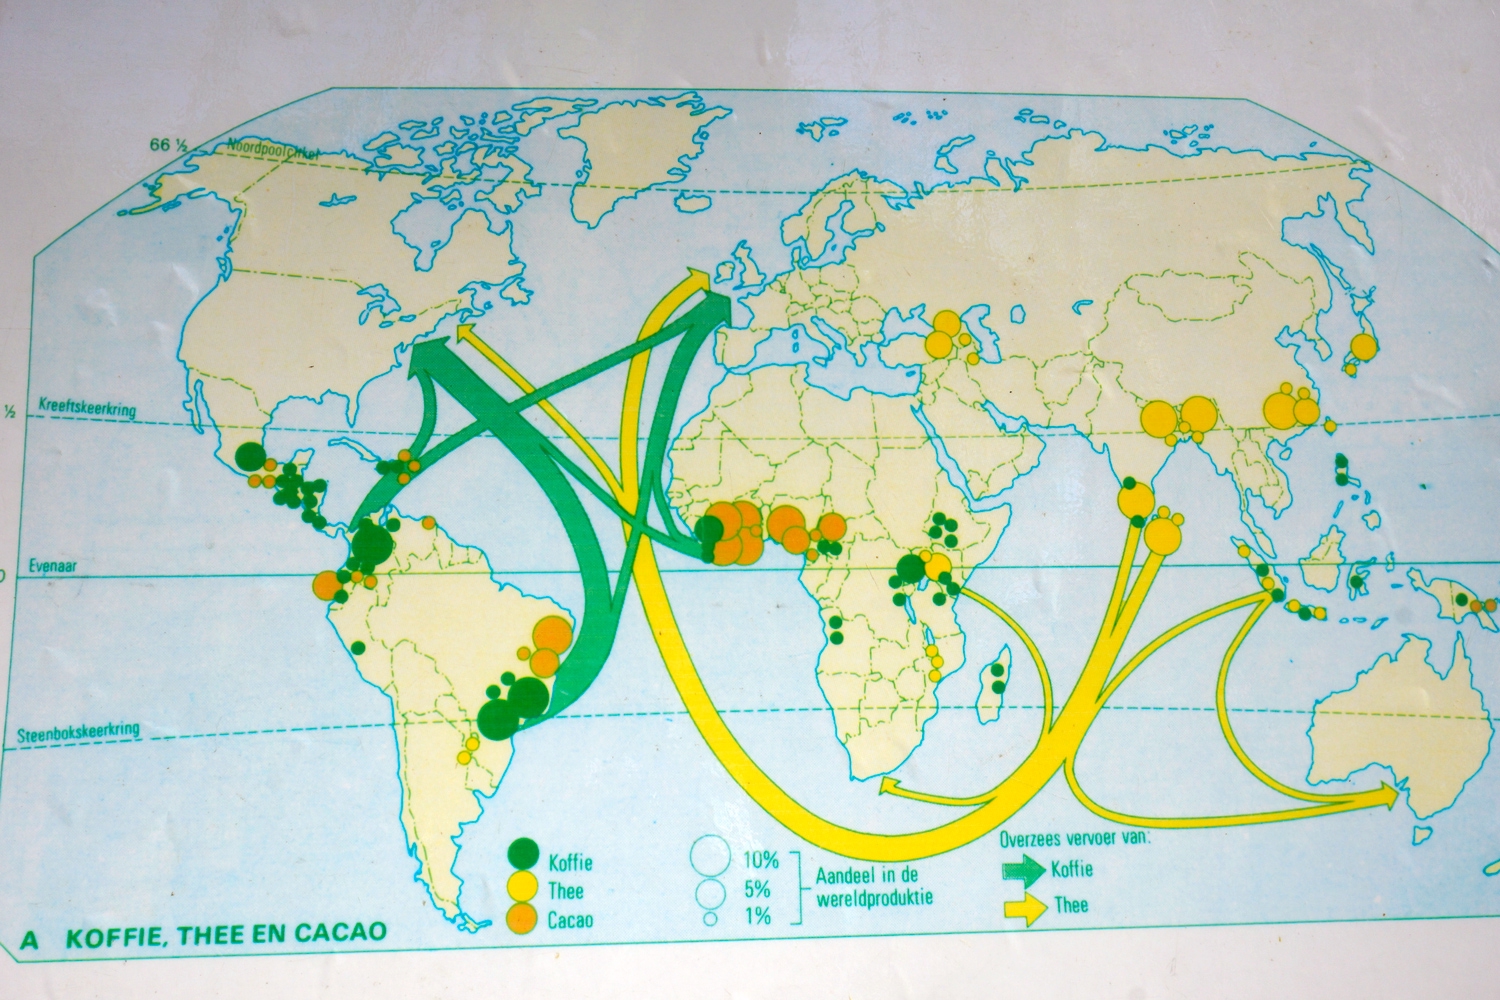
که از جمله در سال 1864 نقشه جریان صادرات مشروبات فرانسه به کشورهای مختلف جهان طبق شکل زیر:


برای توضیحات بیشتر درباره چارلز مینارد به لینک زیر مراجعه فرمائید:

http://en.wikipedia.org/wiki/Charles_Minard

برای توضیحات بیشتر درباره نقشه های جغرافیائی جریان به لینک زیر مراجعه کنید:

http://en.wikipedia.org/wiki/Flow_map


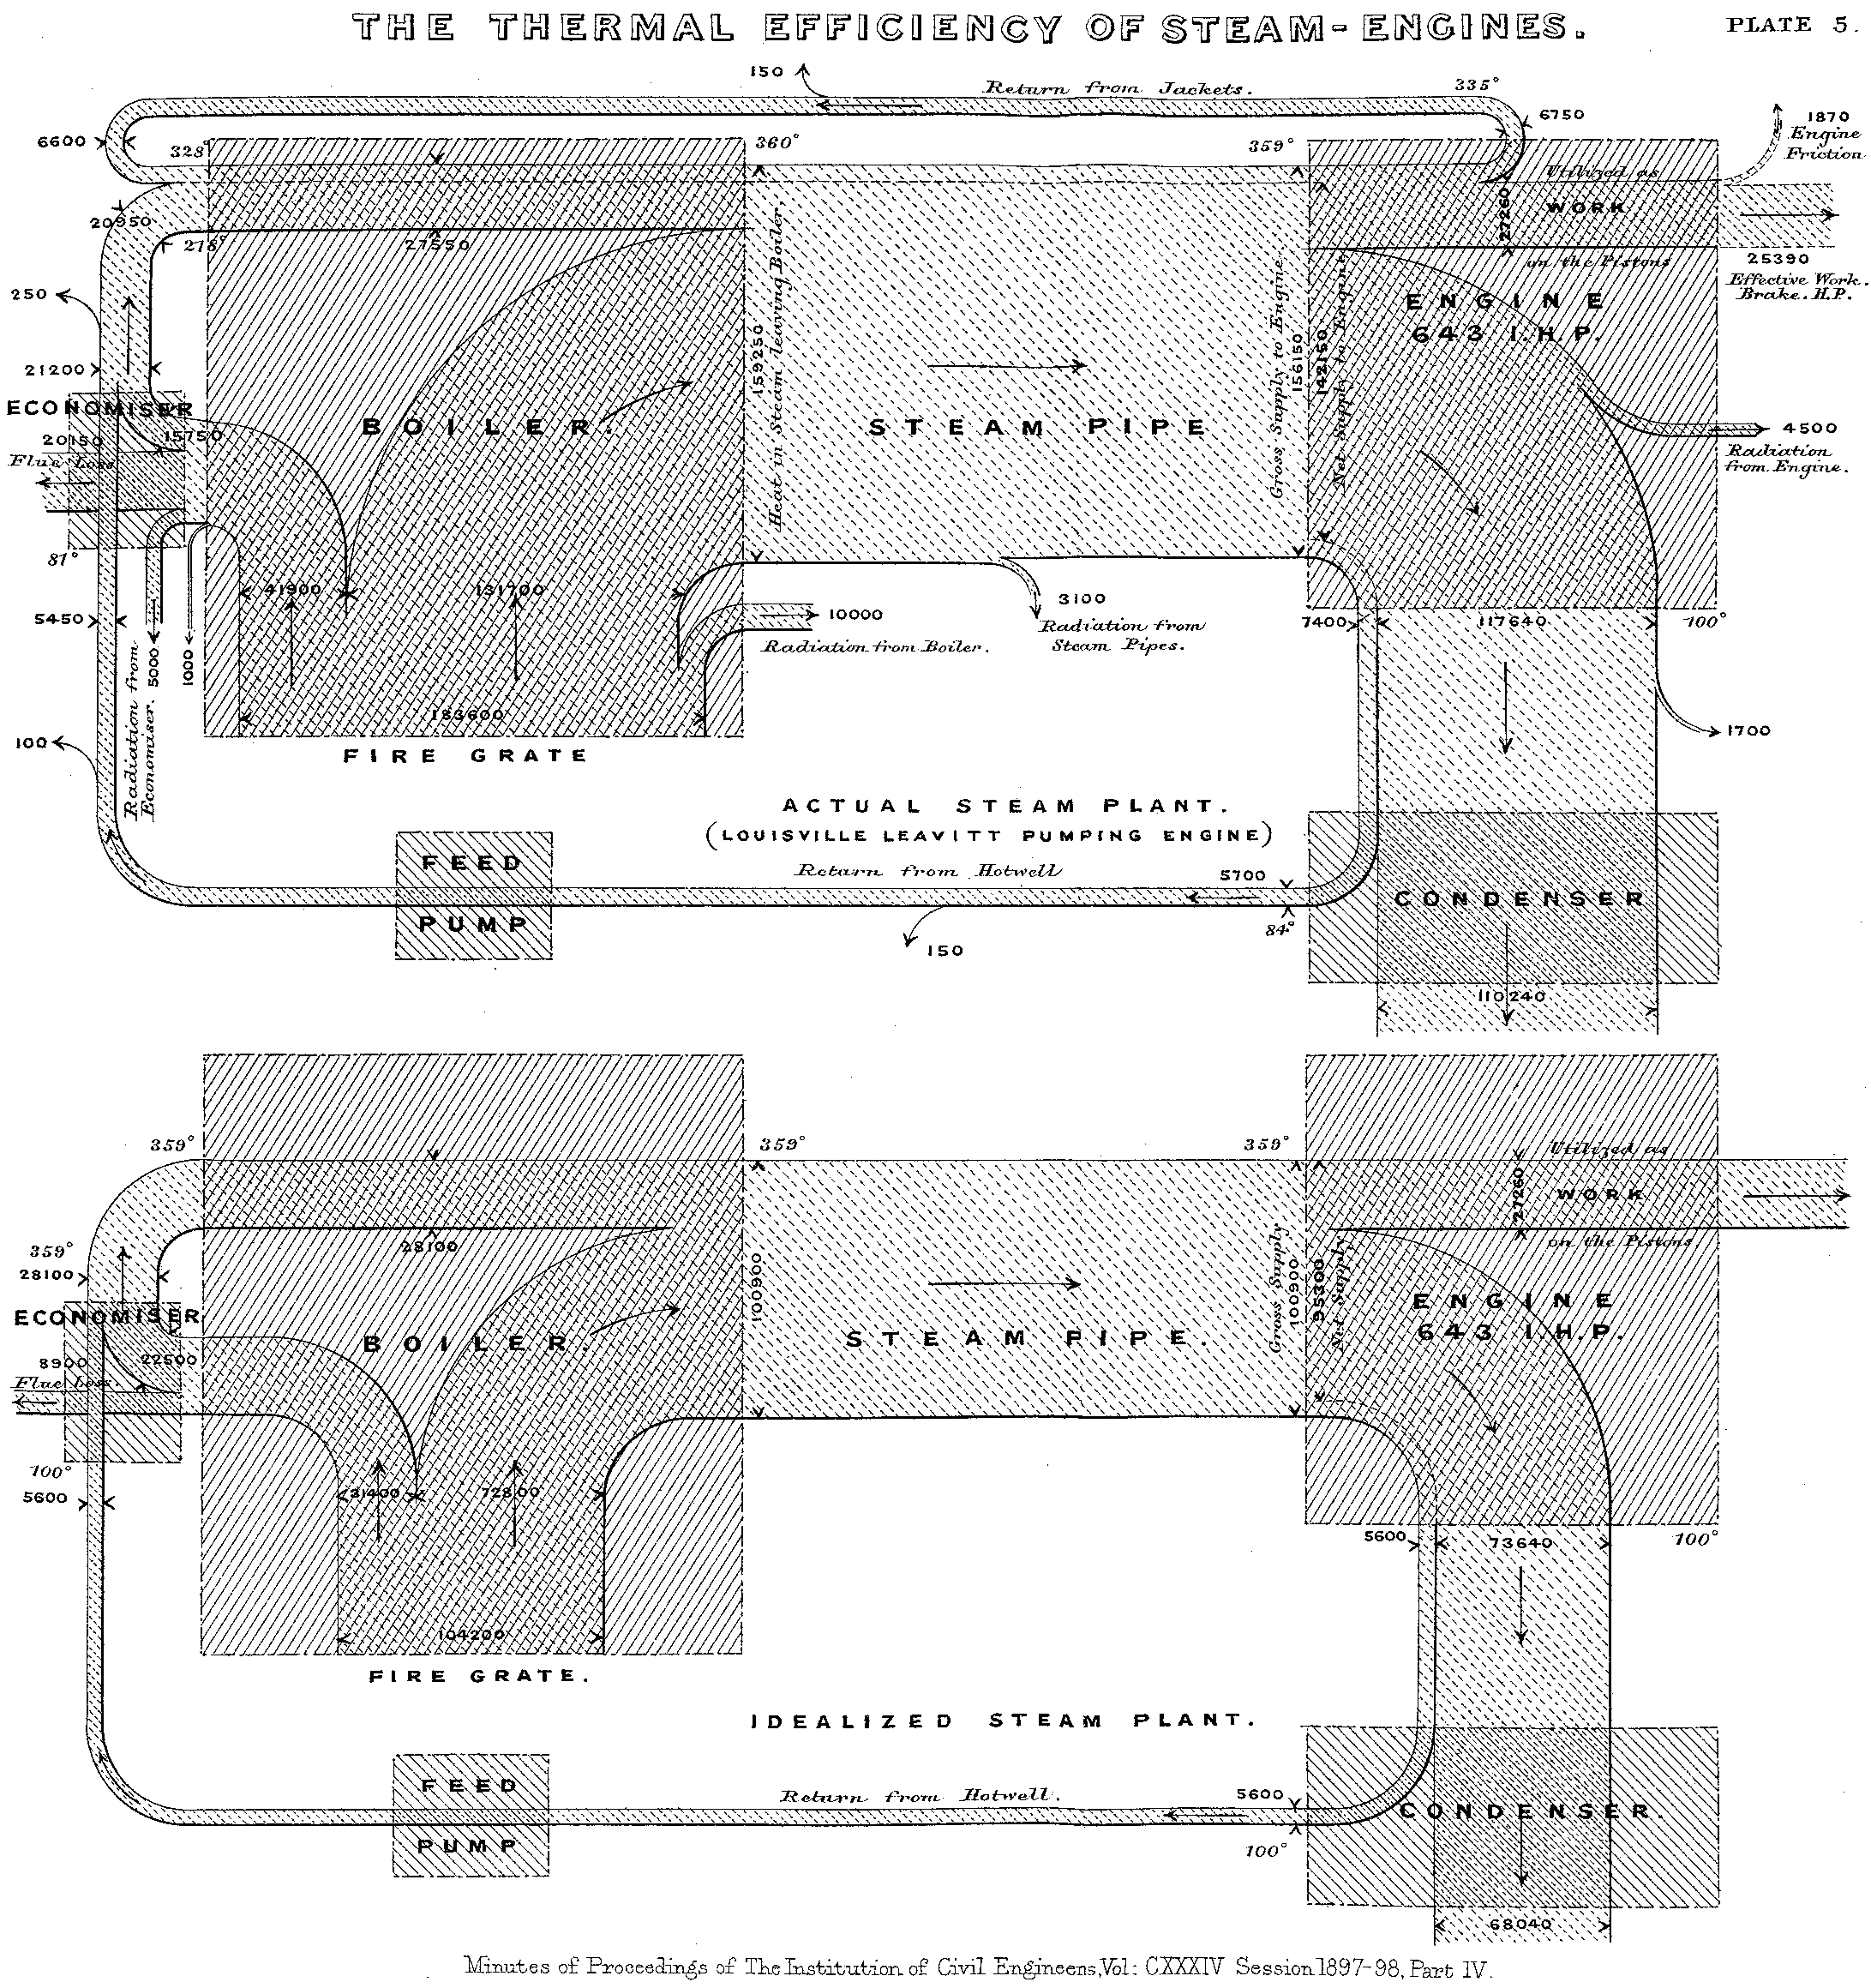
در سال 1898 کاپیتان کشتی متلود ایرلند و فار التحصیل دانشگاههای سوئیس با نام هنری سنکی (Matthew Henry Phineas Riall Sankey)

http://en.wikipedia.org/wiki/Matthew_Henry_Phineas_Riall_Sankey


برای توصیف نمودارهای نقشه های جریان توربین بخار کشتی نمودار زیر را ترسیم نمود:


این نمودارها که تا ان زمان خیلی محبوبیت نداشتند به مرور زمان معروفیت پیدا کرده و تبدیل به شاخه ای از دانش توصیف جریانهای مهندسی شدند مانند مهندسی برق، مهندسی مالی، مهندسی نفت، مهندسی شیمی، اقتصاد، بازاریابی و غیره ....

این نمودارها تقریبا مابین نمودارهای طراحی شده به وسیله نرم افزارهای ساده مانند ویزیو و نمودارهای شبیه سازی مهندسی شیمی مانند اسپن و هایسیس میتوانند باشند.
با این توضیح که نمودارهای طراحی شده به وسیله ویزیو کمتر دارای پارامترهای ورودی و خروجی جریان هستند. و دارای سادگی و حد اقل زمان برای طراحی هستند.

ولی نمودارها طراحی شده به وسیله نرم افزارهائی مانند هایسیس و اسپن دارائی پارامترهای ورودی بسیار زیاد و دقیق برای خروجی با دقت بالای جریان و فرایندها هستند.

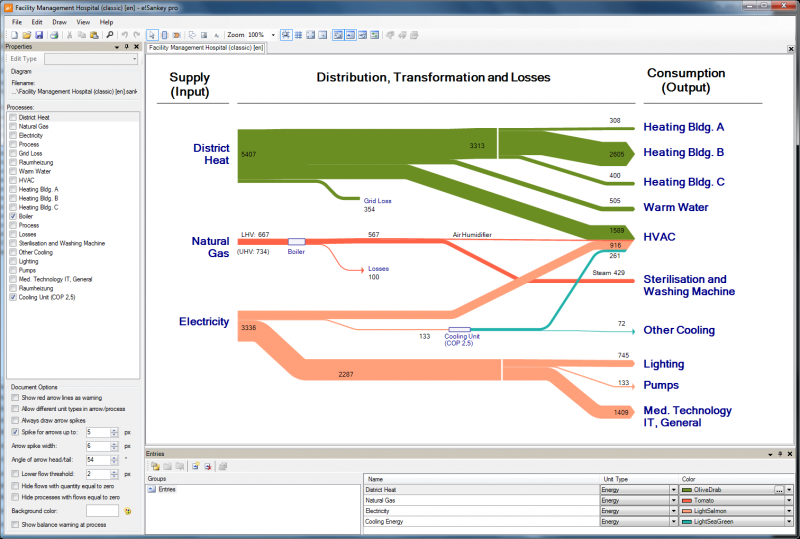
اما نمودارهای سنکی علاوه بر اینکه یک دید هوشمندانه درباره فرایندها و مسیر جریان ارائه میدهند بلکه با نرم افزارهای جدید میتوان تا حد قابل قبولی انها را با پارامترهای مربوطه محاسبه نمود.

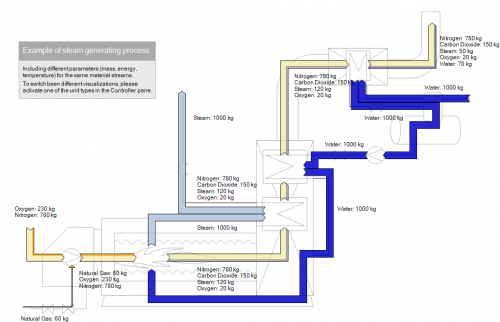
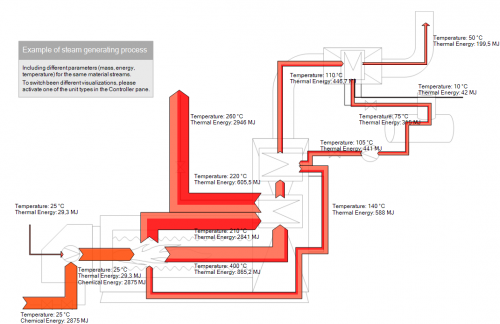
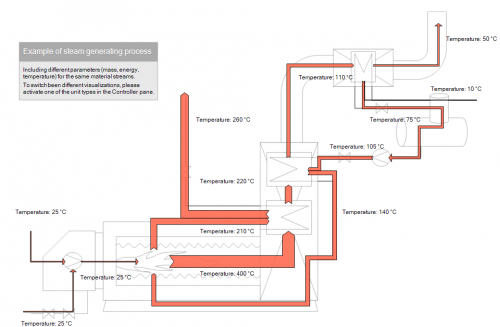
در زیر تصاویری از چند نمونه نمودارهای سنکی را می آوریم:


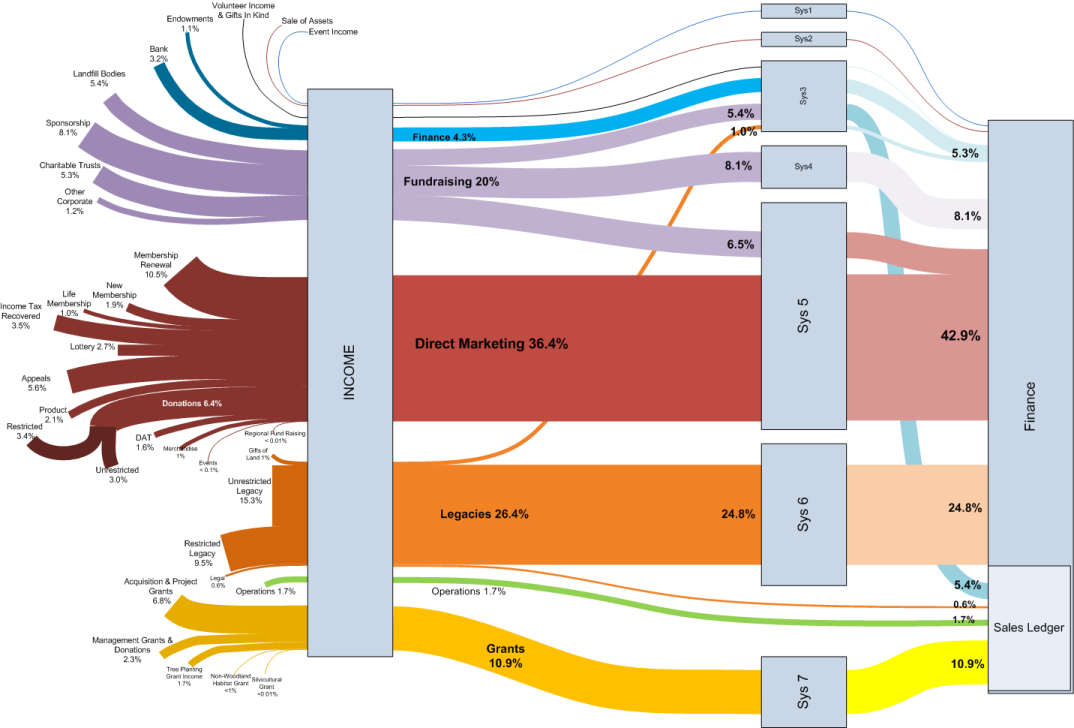
جریان پول در یک سیستم اقتصادی:


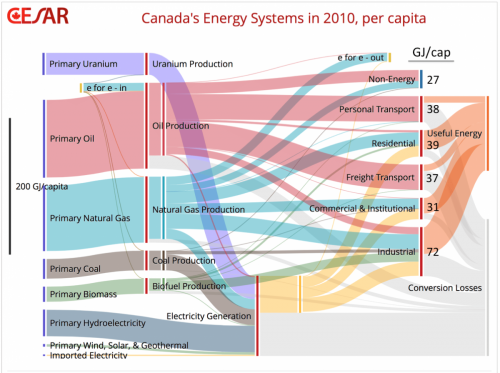
جریان تولید انرژی در ایالات متحده آمریکا در سال 2010


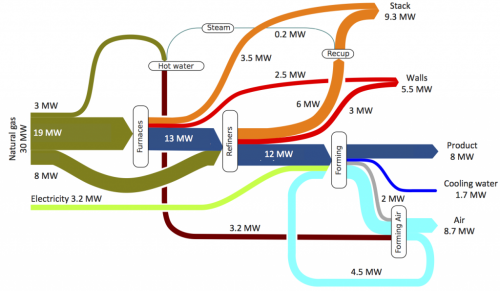
جریان پالایشگاهها و مراکز تولید انرژی و حاملهای انرژی در کشور اسکاتلند:
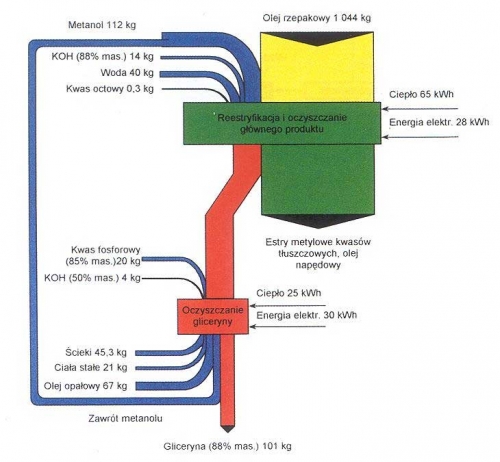
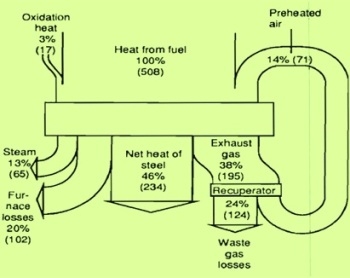
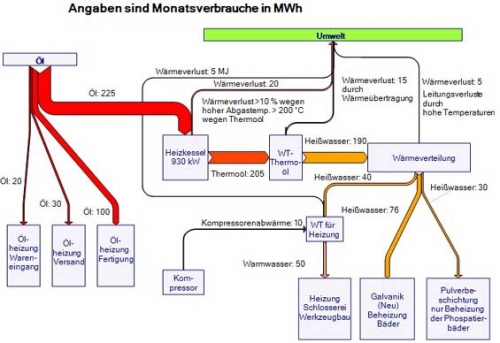


تولید و مصرف انرژی:


برای توضیحات بیشتر درباره نمودارهای سنکی به لینک زیر مراجعه کنید:

http://en.wikipedia.org/wiki/Sankey_diagram

در سایت زیر درباره نمودارهای سنکی مثالها و توضیحات بیشتری وجود دارد:

http://www.sankey-diagrams.com
 

جینگیلبرت

کاربر حرفه ای
کاربر ممتاز
این متد طراحی جریان یا سنکی دیاگرام در ایران خیلی مرسوم و شناخته شده نیست و شما با جستجو در اینترنت اطلاعات بسیار کمی در این باره میتوانید پیدا کنید

از جمله مثالهائی که در ایران و حتی کشورهای عربی حوزه خاورمیانه میتوان آورد نمونه های زیر است:


این یکی سنکی نیست ولی تا حد خیلی کمی رنگ و لعاب سنکی را به خود کشیده است:


جینگیلبرت

کاربر حرفه ای
کاربر ممتاز
چند طرح جالب از نمودارهای سنکی


نیروگاه بخار مزیت دیاگرام سنکی در این است که چندین جریان در یک نمودار قابل نمایش هستند:


دیاگرام جریان انرژی کانادا بر حسب ایالتهای کانادا:


دیاگرام سنکی طراحی شده برای مسافران جام جهانی فوتبال برزیل:


نمودار جریان سنکی برای صادرات بین المللی قهوه چای و کاکائو:


جینگیلبرت

کاربر حرفه ای
کاربر ممتاز
استریفیکاسیون مجدد روغن کلزا:


مثالی از نمودار جریان در یک نیروگاه گازی و سیکل ترکیبی:


نمودار جریان کوره حرارتی یک ذوب آهن:


نمودار جریان بازدهی سیستمهای فرایندی طراحی شده توسط یک شرکت آلمانی:


جینگیلبرت

کاربر حرفه ای
کاربر ممتاز
در این بخش نرم افزارهائی که با انها میتوان نمودارهای سنکی را طراحی و رسم نمود معرفی میگردند:

Full Sankey Software Tools


  • e!Sankey 3.2 (website)
    First released in November 2006, latest version July 2013, a tool by German software firm ifu Hamburg. Version ‘pro’ with Excel interface. This is one of the tools I use for my work, see sample diagrams on this blog. License costs 150 €/300 € (pro). Free trial version.
  • S.DRAW 5.x (website)
    S.DRAW, originally developed by Austrian company STENUM is now being handled by JKMAS in the US and various distributors in Europe. A single license is 485 US$/405 €. Comes with a hardlock key (dongle). Update December 2010. A demo version is available.
  • Sankey Editor 2011 (website)
    A Sankey drawing software by an Austrian company named Stenum. First released in 2005 by LogSim (their website seems dead: website). Single license is 149 €. Demo version available.
  • Sankey Helper 2.4 (website)
    A freeware tool by Gabor Doka from Switzerland that allows to draw simple Sankey diagrams in Excel. It was one of the first software for Sankey diagrams available. Last updated in January 2010.

One specific type of Sankey-style diagrams


  • drawSankey (Wiki website)
    Developed by James Spelling and Germain Augsburger at EPFL in Lausanne. DrawSankey.m draws simple Sankey diagrams in Matlab (input, losses, output). Code available at Matlab Central.
  • Excel to Sankey (blog)
    Developed by Bruce McPherson based on work done by Mike Bostock this code uses d3.js to create left-to-right distribution diagrams over several categories/columns. An interactive version can be created that allows dragging the nodes within the columns.
  • Fineo (website)
    A project by Design Research Lab in Milano. An online tool that can represent relations between dimensions in horizontal bands. Data can be uploaded as tsv file. Similar to ParSets (see below). A comparison is here.
  • jstepien’s Sankey (online)
    A very basic online tool to draw simple left-to-right b/w Sankey diagrams. You can enter a number of named nodes and define the edges with quantities. Didn’t get it to work, but you can see an example here. Download the sources from github.
  • ParSets V2.1 (blog)
    A project by Robert Kosara, featured on eagereyes. Freeware for Mac, Windows and Linux. Can do top-down oriented bands, hooked to nodes (categories). Data can be imported from CSV file. Similar to Fineo (See above).
  • Sankey (Sankey @ github)
    A Mathematica workbook by Sam Calisch that can be used to draw left-to-right distribution diagrams with several nodes ordered in columns. An example of the output can be seen here.
  • SankeyBuilder (Blog)
    Sankeybuilder is another online tool for distribution diagrams using d3.js. An implementation can be seen on heatmap.ca
  • Sankey by tamc (tamc/Sankey @ github)
    Commenter Colm O’G suggested this javascript library for drawing sankey / flow diagrams in a browser to be added to the list, thanks. This seems to have been inspired by Fineo. An online implementation example can be seen on Andy Tow’s Atlas Electoral here.
  • Sankey Diagrams in Python (matplotlib @ Sourceforge)
    ‘matplotlib’ is an open source project. Now has functionality to draw left-to-right oriented Sankey diagrams. Features available are labeling of flows, formatting of colors, fonts, borders, etc.
  • Sankey Diagram Maker v1.08 (blog)
    New in 2012, a freeware tool provided by H.J. Berchmans, downloadable from Google Docs. .NET 4.0 must be installed on your machine. Users can draw simple left-to-right Sankey diagrams, choose colors.
  • Sankey Generator 0.4 (blog)
    Result of a student project by Sam Brenner, not intended to be launched commercially. Allows drawing of simple inflow/outflow Sankey diagrams. Code has been released to public domain.
  • SankeyMATIC (webpage)
    An online tool by Steve Bogart. Users can enter their value sets in a list box, diagram will create automatically. Based on open source d3.js and its Sankey library.
  • Sankey PROFI Energie (webpage, in German only)
    A software with templates for energy management, available in German only. Published by software reseller WEKA, from the looks it is most likely a customized/branded version of e!Sankey (see above).
  • SankeyR (blog post)
    An adaptation of the Matlab drawSankey function (see above) to work in R by Aaron Berdanier at Colorado State. Simple left to right Sankey diagrams. New release in July 2010.
  • SimSankey (website, in German only)
    This small-scale tool by a company named ‘Similar’ from Germany, allows to draw simple top-down-oriented energy diagrams.

Former Sankey diagram software whose fate is unclear


  • Sankey 3.1 (no website known)
    The fate of this tool is unknown. It was developed and distributed by Fichtner Consulting from Stuttgart, Germany in the late 1990ies. However, no information or screenshots can be found on the web.
  • Sankey.Vis (website, now redirected)
    From the makers of the interactive Sankey diagram tool at Bauhaus University Weimar. The developers seem to have founded a company in Berlin and we could see this tool being developed further.
  • Yekans (website offline)
    This software probaly never got beyond the first idea, and a small website. Website not available any more.
Software with different areas of application, that have some kind of Sankey functionality

  • CASAnova (website)
    Subtitle: An Educational Software for Energy and Heating Demand, Solar Heat Gains and Overheating Risk in Buildings. This freeware tool allows to enter numerous parameters for a building, and will eventually produce a Sankey diagram of energy flows.
  • eMPlant
    eMPlant (part of the UGS Tecnomatix Suite) claims to “Material flow may be visualized in a Sankey chart that, at a glance, shows transport volume in the context of the layout”. I have not verified this information.
  • Foreseer (website)
    An online tool will help users predict trade-offs between the global commodities of energy, water and land. Developed at University of Cambridge by Julian Allwood and his research group. Foreseer relies heavily on Sankey diagrams.
  • GaBi (website)
    A Life Cycle Assessment (LCA) software for analyzing the environmental impacts of a product. This tool by German maker PE Europe can visualize the flows of material in a life cycle with Sankey diagrams.
  • HSC Chemistry (website)
    A simulation software package for chemical processes by Outotec Research Oy from Finland. “The HSC-Sim module has built-in ‘Sankey diagrams’ to visualize the distribution of the elements and process variables”.
  • LESOSAI (website)
    A software for calculating the heat balance of a building. Developed by the Solar Energy and Building Physics Laboratory at the EPFL in Lausanne, it is marketed by a company E4tech. Sankey diagrams for heat losses in a building can be dispayed.
  • OpenLCA (Help page)
    Another Life Cycle Assessment software that has a basic Sankey diagram feature as “graphical illustration of the impacts of different flows in the product system”.
  • Pleiades + Comfie (website)(Wiki)
    Pleiades + Comfie is a software for energy simulation in builings by a French company named Izuba. Although I haven’t seen any screenshot, it seems to have some kind of Sankey diagram output.
  • SimaPro (website)
    Another LCA software, by PRé Product Ecology Consultants from Amersfoort, Netherlands. The contributions of the individual life cycle phases are displayed in a tree-like Sankey-style graphic.
  • SIMBA / ifak-Sankey (website)
    A simulation software developed by ifak at the University of Magdeburg, Germany. SIMBA was developed to simulate wastewater systems, and also has a Sankey display feature. They are also the maker of ifak-Sankey (offered by Kontenda).
  • STAN 2 (website)
    STAN is a software for substance flow analysis, developed by inka software for the University of Technology of Vienna, Austria. It has a feature for displaying flows in their network diagrams as Sankey arrows. Version 2.0 released May 2009.
  • STOAT (website)
    A dynamic simulation software solution for waste water treatment plants from Berlin-based consulting firm EnviaTec GmbH. Has a simple Sankey diagram interface, that allows to show, e.g. COD loads.
  • T*SOL (website)
    A software for dynamic simulation of solar thermal systems by Valentin Energiesoftware GmbH in Germany. The energy balance can be displayed as table or as a Sankey flow chart.
  • Tecnomatix Plant Simulation (website)
    This comprehensive plant simulation software package claims that “Material flow may be visualized in a Sankey chart that, at a glance, shows transport volume in the context of the layout”. A Sankey-like diagram is shown in their product brochure.
  • Umberto NXT Efficiency (website)
    A material flow management and process modeling software by ifu Hamburg GmbH. A display of the flow values in a Sankey diagram has been a feature of this software since version 3.0 (current version is Umberto 7.0). They are also the maker of e!Sankey (see above).
  • Umberto NXT CO2 (website)
    A special version of Umberto, that can be used for calculating a product carbon footprint. The footprint model can be displayed as a carbon rucksack Sankey diagram, with CO2-equivalents.
  • Umberto NXT LCA (website)
    Another member of the Umberto product family (see above). This one is for doing Life Cycle Assessment (LCA) studies. The contributions of the materials and emissions to the impact categories are visualized using Sankey diagrams.


به نقل از:

http://www.sankey-diagrams.com/sankey-diagram-software
 

جینگیلبرت

کاربر حرفه ای
کاربر ممتاز


شاید یکی از بهترین نرم افزارهای موجود دنیا نرم افزار E!Sankey باشد
این نرم افزار توسط یک شرکت آلمانی تولید شده و امکانات کاملی در اختیار یک طراح نمودار جریان سنکی قرار میدهد.

سایت نرم افزار:

http://www.e-sankey.com

داونلود مستقیم نرم افزار:

http://update.ifu.com/shareit-demo/esankey/esankey.exe

نرم‌افزار e!sankey نرم‌افزاری بسیار ساده و در عین حال قدرتمند در ترسیم جریان‌های انرژی، هزینه و غیره می‌باشد که در کشور عموما با نام سنکی دیاگرام شناخته می‌شوند.


در حال حاضر تنها نسخه دمو نرم‌افزار موجود و کرکی برای آن وجود ندارد. نسخه دمو تقریبا تمامی ویژگی‌های کلیدی نسخه اصلی را بغیر چاپ آرم e!sankey در گزارش‌های خروجی دارا می‌باشد که آن هم بسادگی با نرم‌افزارهای ویرایش عکس (حتی paint !) قابل حل شدن است و ارزش اندکی وقت اضافه را دارد! این نسخه تا 30 روز کارکرده و پس از آن می‌توانید با پاک کردن کامل رجیستری مربوط، دوباره آن را نصب و فعال نمایید. در صورت نیاز طولانی مدت برای استفاده از نرم‌افزارهای رسم جریان، پیشنهاد می‌گردد این نرم‌افزار را خریداری نمایید و مطمئن باشید یکی از بهترین‌ها را خریده‌اید!


جینگیلبرت

کاربر حرفه ای
کاربر ممتاز
هوشمندی جریان

نمودارهای اشاره شده در فوق در اصطلاح Show the flow یا نمایش دهنده جریان یا توصیف کننده جریان میباشند.

اما با پیشرفت علوم و فنون و تکنولوژی، به خصوص رایانه در دانش بشری

نمودارهای جریان سنکی طراحی شده اند که Know the Flow هستند بدین معنی که بخشی از امکانات نرم افزارهائی مانند هایسیس مورد استفاده در شبیه سازی های مهندسی شیمی را دارند
منتها با این تفاوت که بسیار ساده بوده و در عین حال در تمامی فرایندهای دانش بشری از اقتصاد، حسابداری، مهندسی مالی، مهندسی شیمی، مهندسی صنایع، مهندسی برق، مهندسی محیط زیست، مطالعات انرژی و غیره مورد استفاده قرار میگیرند.

این نرم افزارها برای مدیریت استراتژیک و تصمیم سازی ها و بهینه سازی فرایندها یا Optimization مفید و مناسب هستند.

نمونه ای از این نرم افزارها در زیر آمده است که در پستهای بعدی بیشتر درباره اینها توضیح خواهیم داد:

 
بالا